Marine Protected Areas and Coral Reef Mapping
Marine Protected Areas, also known as MPAs, have been suggested as areas set aside and protected from fishing and other human influence in order to conserve the organisms that live there. The idea is also that the positive impacts of these areas will “spillover” into neighboring, unprotected areas. MPA is an umbrella term, used to describe various levels of marine protection. Some MPAs are species-specific, aimed at protecting one important fishery, and some are ecosystem based. MPAs are often criticized as being “paper parks” because they have legislation in place, but lack significant enforcement. The strictest form of MPA is a No-Take Area, or NTA. In an NTA nothing can be removed, dead or alive, without a permit, in which case the removal must be for scientific use. The entire island of Bonaire represents a strict and long-term established NTA. Bonaire is located in the southern Caribbean Sea (Figure 1) and is part of the Netherlands Antilles ABC island chain, which includes Aruba and Curacao. Tourism, specifically SCUBA diving, makes up a large portion of Bonaire’s gross national income. Because of this, the health of its coral reefs is critical to its economy and thus, must be well protected. The Bonaire National Marine Park (BNMP) represents the NTA, which exists from the shoreline out to a depth of 60 m around the entire island and is aimed at the conservation of the important coral reef ecosystem. The BNMP is managed by Stichting Nationale Parken Bonaire (STINAPA Bonaire), a non-governmental, not for profit foundation commissioned by the island government.
In January of 2008 a team of scientists from five institutions around the world set out to map the relatively pristine reefs off the coast of Bonaire. One of the principal investigators for the project was Dr. Mark Patterson, of the Virginia Institute of Marine Science (VIMS). Dr. Patterson was accompanied by his graduate student, Noelle Relles, who was working on her PhD in Marine Science at VIMS and the College of William & Mary. During the expedition, Noelle’s job was to devise a way to measure coral cover and species composition off the coast of Bonaire and compare it to earlier work done in the area by Dr. Fleur van Duyl (1985). Data were collected by scuba divers using a digital camera on video setting in an underwater housing. The first diver (D1) used a compass to navigate perpendicular to the shoreline and kept a steady pace. D1 also controlled a reel of rope that was connected to a surface-floating Global Positioning System (GPS), which recorded the geographic location (latitude and longitude) of the divers. The second diver (D2) followed D1 along the transect and recorded the video facing down toward the bottom, approximately 2 m from the bottom. Video was recorded from the shore out to a depth of 20 m; an Oceanic® dive computer attached to D2 recorded depth. The dive computer, GPS and video camera were all synched in time.
Upon returning to VIMS, the videos were separated into still frame photographs and then analyzed using Coral Point Count with Excel® Extensions (CPCe). CPCe is a computer program that allows users to open an image, overlay random points on it, and visually identify the substrate underneath each point. Based on the user’s identifications, CPCe produces an accompanying Microsoft Excel® spreadsheet, which gives values of percent coral cover and species diversity. This program offers a large technological advantage because in the past a researcher would have to use a computer program to generate random points, lay the points over the image him or herself, and make calculations of diversity and cover by hand. CPCe facilitates significantly faster processing, and therefore more data can be processed in a shorter time period. It can also be easily modified for use in environments other than tropical coral reefs as long as there is picture clarity.
The resulting data set will be compared to a reef map of Bonaire published in 1985; data from which was collected from 1980-1983. Since the BNMP was established in 1979, the change over two decades will be a demonstration of the effectiveness of marine-protected areas. A comparison of changes in coral cover in Bonaire versus the rest of the Caribbean will be useful in determining whether Bonaire’s NTA has been successful at conserving its coral reef ecosystem on which it depends for tourism. The information from this study will be used by the managers of the marine park to focus on future areas of concern. It will also be taken into consideration by the island government when making future decisions, particularly regarding development on the island.
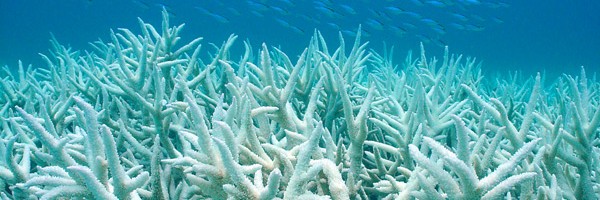
Land development is of particular concern for coral reefs because it leads to decreased water clarity. Water clarity is important for corals because they share a symbiotic, mutually beneficial relationship with zooxanthellae, an algal symbiont. The zooxanthellae perform photosynthesis, which requires sunlight and provides fixed carbon to the coral host. The coral is obligated to this symbiotic relationship and cannot live for long periods of time without the zooxanthellae. However, when the coral is stressed it expels the symbionts, a phenomenon known as coral bleaching. It is known as bleaching because the zooxanthellae provide the coral with its pigment and once they are expelled the coral turns white. Cases of coral bleaching and subsequent mortality are increasing in frequency as a result of climate change and its associated increases in sea surface temperature because most corals already live at the top of their temperature range.
Biodiversity
Coral reefs are one of the most biodiverse habitats in the world; meaning many species live or depend on the reef for food and shelter. Because coral reefs have such high biodiversity they are very important to the health of the ocean creating stability in water chemistry and sediment transport, improving water quality and controlling carbon dioxide levels. Unfortunately coral reefs are very susceptible to small changes in water quality and environmental conditions, overfishing and habitat destruction. Biodiversity can be quantified in several ways, including: species richness; the Simpson index; the Shannon-Wiener index (or more commonly, the Shannon index); and species evenness. These indices allow scientist to compare different sites using the same measures, allowing for an “apples to apples” comparison.
AUV/ROV Technology
The work we will be focusing on in this activity was performed by certified human SCUBA divers. However, technology exists that allow this work to be performed without human divers, presenting a safer option that requires less overall manpower and allows for the work to be done more efficiently, covering more area in less amount of time.
When humans SCUBA dive, they can only spend a short amount of time breathing compressed air underwater before they have to return to the surface and begin breathing ambient air. Breathing compressed air causes a build up of nitrogen in the blood. If not expelled by breathing uncompressed air, the diver can suffer from decompression sickness, also known as the bends. Coming to the surface and expelling the built up nitrogen is known as a surface interval and typically last about 45 minutes to one hour.
By using unmanned technologies, such as autonomous underwater vehicles (AUVs) and remotely operated vehicles (ROVs), surface intervals are not necessary, resulting in more time for underwater research. The sensors these underwater robots support are capable of measuring various biotic and abiotic parameters, including underwater photography and videography, and typically only require a small team of people to launch, operate and recover them. Both types of underwater robot have advantages and disadvantages, mostly revolving around the fact that ROVs are tethered to the surface, while AUVs are free-swimming.
Data Activity
I. Snapshot Analysis
Using the coral reef key (Figure 2), identify what lies immediately beneath the center of each of the 50 random points in Figure 3 and Figure 4. Record your answers in Table 1 of the Coral Snapshots Excel Spreadsheet.
In Table 2, column B, combine your data from Table 1 into the six listed categories for both the 1000 Steps shallow and deep sites. Next, in column C calculate the Percent of Transect for each identifier (stony coral, octocoral, etc.) by dividing the abundance of each individual identifier by the Total Abundance (do not include the abundance of the Shadow identifier). *Note that Table 2 will do several calculations for you (pink and green cells) and produce several biodiversity indices you learned about earlier. These include:
II. Comparing Biodiversity
Table 3 includes representative Shannon-Wiener Indices and other traits from the other project-sampling sites around Bonaire (refer to Figure 1, the map of Bonaire as needed) [link to map, again]. Add the Shannon-Wiener Indices you calculated for both 1000 Steps sites and the Percent of Transect for the stony corals and octocorals.
Discussion Questions
Extensions
School yard snapshots
Author
Christopher J. Petrone and Noelle J. Relles, Virginia Institute of Marine Science
Grade Level
8-12
Lesson Time
60 min
Objectives
Vocabulary
coral reef, biodiversity, Marine Protected Area, richness, evenness, Shannon Wiener Index, stony coral, octocoral, AUV, ROV
Materials Required
Figures 1-4, Coral Snapshots Excel Spreadsheet
Natl. Science Standards
IK-1 IK-2 L5-1 L5-4 L9-4 TK-2 TK-3 PS5-4 PS5-5 PS9-3 PS9-3 PS9-4 PS9-6 NK-1 N9-2
Join the ocean education conversation! Scuttlebutt is the national email discussion list for educators and scientists interested in talking informally about ocean education ideas, issues and questions.
All educators and scientists interested in marine science education are invited to subscribe. The Bridge staff monitors list activity and often is able to assist in locating expertise to answer questions that teachers post to the list, as needed. The list does not provide research services for students' assignments.
Scuttlebutt carries messages related to marine education that should be of professional interest to many marine educators nationwide. Petitions, political commentary or advocacy, resumes or job requests, requests for donations or votes, crowdsourcing, cross postings and commercial messages are not accepted. Please restrict attachments to a total size of 500kb or less.
Copyright © 2022 - All Rights Reserved - the BRIDGE
Template by OS Templates