bridgelogo
bridgelogo

<

Coral Bleaching

A White Hot Problem

Summary
Assess coral bleaching using water temperature data from the NOAA National Data Buoy Center.

Introduction
Coral Bleaching The magnificent beauty of a coral reef is a true masterpiece of Mother Nature. A reef is a sculpture of living organisms, varied in color, texture, shape, and size. The creation of these works of art takes many, many years (some reefs are thousands of years old), and they don't exist solely for show. Reefs are building blocks for rich communities, providing habitat for a myriad of organisms, and they are some of the most diverse ecosystems on the planet. In addition, they support fishing grounds, attract tourists, and protect shorelines from waves and storms.

Coral reefs exist in a geographical band 30 degrees north and south of the equator. Corals are cnidarians (related to jellyfish and anemones) and have symbiotic algae called zooxanthellae living in their tissues. These zooxanthellae are photosynthetic and produce food for the coral during the day. Corals live in waters with a salinity range of 30 to 40 ppt and can tolerate water temperatures between 16-35 °C, but the ideal temperature for growth is between 23-25 °C.

Sadly, coral reefs around the world are suffering the hardships of environmental stress. Corals are susceptible to a number of stressors, both natural and human-induced, including pollution, sedimentation, increased temperature, ocean acidification and physical damage by humans. These stresses can kill coral reefs outright, or make the corals more susceptible to disease.

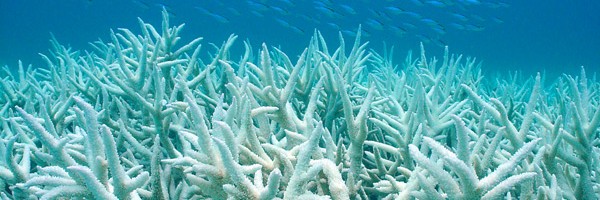
Average global sea temperature has been rising gradually over several decades, 0.7 °C in the past 30 years alone, which is generally believed among the scientific community to be due to global warming. This thermal stress can cause coral bleaching, or the loss of zooxanthellae from the coral tissues. Since the zooxanthellae are what give the coral tissue their color, the loss of them make the coral appear white. With the loss of the photosynthetic algae, corals lose their primary food source and can die.

Corals which had thrived along Australia's Great Barrier Reef for hundreds of years suddenly died in 2016. It was the worst year ever recorded globally for coral bleaching up to that point, and it brought the hottest sea surface temperatures since 1998. View a NOAA animation of coral bleaching hot spots (areas where the sea surface temperature exceeds the climatological expected maximum for that region by 1° C or more, colored orange to red).

In 2005, sustained high sea surface temperatures caused coral bleaching in the Caribbean. According to some scientists, the 2005 Caribbean bleaching events were bigger than all the previous 20 years combined. The effects from this are still being felt now. Recently, there was a large die off of corals off the coast of Puerto Rico and the U.S. Virgin Islands. These corals had survived the high heat of 2005 but were weakened and succumbed to white plague disease. The following data activity examines NOAA water temperature data for San Juan, Puerto Rico for 2005 through 2008. We will compare the observed water temperature with the known stressful temperature level for coral reefs and discuss the affects.

Data Activity
Bridge - April 2006 Data Tip Corals can survive in water temperatures up to 35 °C, however the optimal growth temperature for corals is around 25 °C. Researchers have determined that, for any given area, water temperatures of 1 °C above the expected summertime maximum temperature is stressful to corals. If an area experiences this it is called a coral bleaching HotSpot. If the thermal stress lasts for a week or longer, the stress accumulates. To measure this, researchers use a degree heating week (DHW) value. If the temperature is above the expected average maximum for one week, the DHW is 1. If the temperature is 2 °C higher than the expected maximum for one week then the DHW value is 2. You can also get a DHW value of 2 if the temperature is 1 °C higher for 2 weeks.

For Puerto Rico, the expected summertime maximum temperature is 28.5 °C. This makes the DHW level 29.5 °C.

Print the following graphs of observed daily water temperature for San Juan, Puerto Rico for 2005 - 2008. These data were collected by the NOAA National Data Buoy Center. Each year has its own graph, and the last graph shows all years (2005 - 2008) compiled.

In the graphs, the vertical lines mark one-week time periods. The yellow line marks the 1 DHW level of 29.5 °C and the red line marks the 2 DHW level of 30.5 °C.

A study conducted by researchers from the University of Puerto Rico found that 54 days of 29.5 °C water temperatures or 10 days of 30.5 °C water temperatures correlated with severe coral bleaching.

Print out the student worksheet, and fill in the answers to the following questions.

  • For each year, approximately what date did the water temperatures of San Juan, PR hit 1 °C above expected summertime maximum?
  • For each year, approximately what date did the water temperatures hit 2 °C above expected summertime maximum?
  • What date did the water temperature drop and remain below the 2 °C above expected maximum for the remainder of the year?
  • What date did the water temperature drop and remain below the 1 °C above expected maximum for the remainder of the year?
  • Approximately how many weeks over the year were temperatures 1 °C above expected maximum?
  • Approximately how many weeks over the year were temperatures 2 °C above expected maximum?
  • How many Degree Heating Weeks (DHW) were there for the year? (Remember: 1 week at 1 °C above expected maximum = 1 DHW and 1 week at 2 °C above expected maximum = 2 DHW

Compare your answers to the Bridge Answer Sheet.

Discussion Questions

  • As you know, 2005 was a year of high water temperatures. How do the years 2006-2008 compare to 2005?
  • What trend, if any, do you see in the number of DHWs over the 2005-2008 time period? Is this a long enough period of time to determine a trend? If not, how long a time period would you suggest?
  • Based on the 2005-2008 data, what would you expect to see for water temperatures in San Juan, PR for 2009? (Access the San Juan, PR NOAA buoy data to see the current water temperature.)
  • Over the next few decades, if water temperatures continue to remain high for long periods of time at a stretch (resulting in significant DHWs per year), how do you think this will affect coral reefs? What impact would this have on the ecosystem? On the local economy?

Coral reefs are considered to be the key to tropical ocean ecosystems, and marine scientists warn that their decline could be a prelude to widespread ecological damage. Want to help reverse the trend? Here are 25 things you can do to save coral reefs.

Print-friendly View

Read Me

Author
Laura Rose & Lisa Ayers Lawrence, Virginia Sea Grant, Virginia Institute of Marine Science


Grade Level

9-12


Lesson Time

1 hr.


Objectives

  • Describe the relationship between corals and zooxanthellae.
  • Identify stresses to corals.
  • Explain coral bleaching and the processes that cause coral bleaching.
  • Examine water temperature data and compare to levels known to induce coral bleaching.
  • Predict the effects of prolonged, increased temperaturs on coral reefs.

Vocabulary

Cnidarian, Zooxanthellae, Sedimentation, Coral bleaching, HotSpot, Degree heating week


Materials Required

San Juan water temperature graphs (pdf)
Student worksheet (pdf)
Answer sheet (pdf)


Natl. Science Standards

IK-1 IK-2 L5-3 L5-4 L9-4 L9-6 PS5-2 PS9-4


Related Materials

Coral Snapshots
Biodiversity in Marine Protected Areas

While it is possible to survey a coral reef using quadrats, scientists more frequently use technology to closely examine the entire reef; instead of extrapolating results from several study sites. Researchers at the Virginia Institute of Marine Science are taking video of reefs and then analyzing it via a computer program back in the lab. This method cuts down on the inherent error associated with the quadrat system and actually requires less time and money spent in the field.
El Niño
The Return of El Niño

Examine temperature and precipitation data to determine if climate variations are due to El Niño.
Scripts